![]()
7. Loki
like Prometheus, but for logs. Loki is a horizontally-scalable, highly-available, multi-tenant log aggregation system inspired by Prometheus. It is designed to be very cost effective and easy to operate. It does not index the contents of the logs, but rather a set of labels for each log stream. Loki differs from Prometheus by focusing on logs instead of metrics, and delivering logs via push, instead of pull.
7.1. Install docker-compose
sudo curl -L "https://github.com/docker/compose/releases/latest/download/docker-compose-$(uname -s)-$(uname -m)" -o /usr/local/bin/docker-compose
sudo chmod +x /usr/local/bin/docker-compose
7.2. Start Loki, Grafana, Promtail,AppMesh
cd app-mesh/script/docker
docker-compose -f docker-compose-all-in-one.yaml up -d
7.3. Configure Grafana
Open Grafana on 3000 port (http://grafana_node:3000/)
Add DataSource: Loki
Input Loki address: http://script_loki_1:3100 (this address is Grafana access Loki docker container name)
Select Explore -> Log labels -> job
7.4. Stop and clean
cd app-mesh/script/docker
docker-compose -f docker-compose-all-in-one.yaml stop
docker-compose -f docker-compose-all-in-one.yaml rm -f
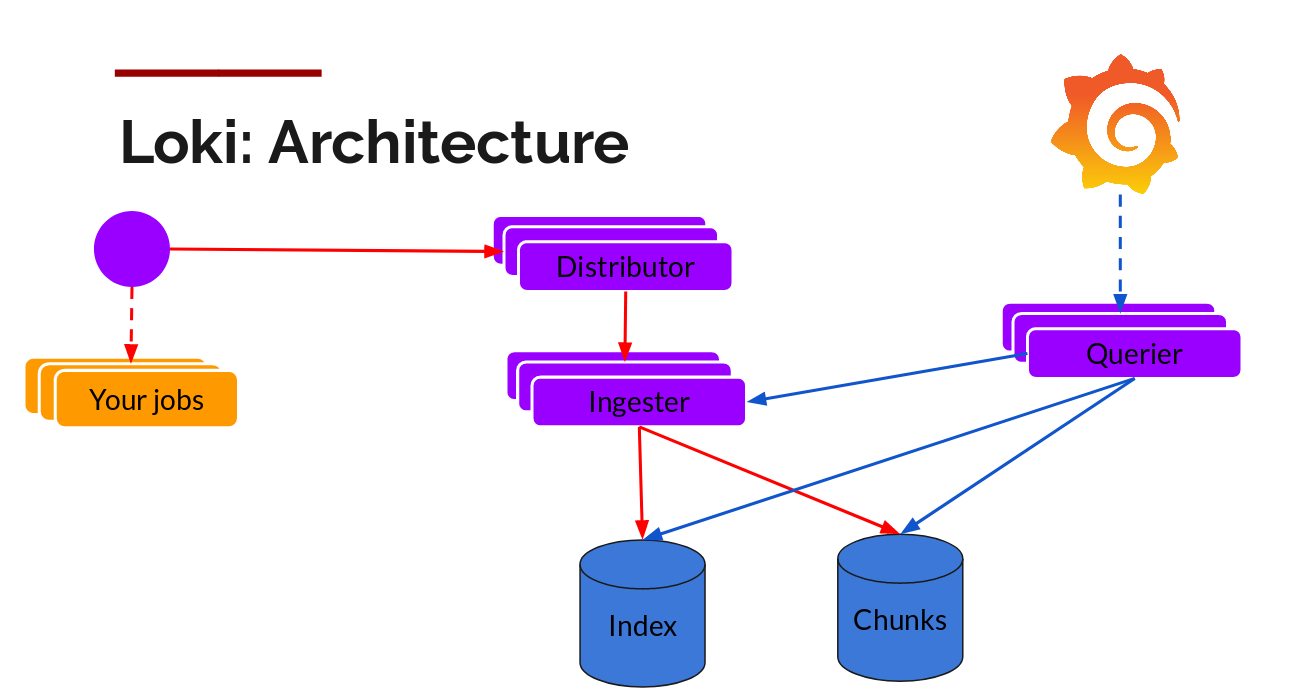
7.5. Design
Loki is a log aggregation system, component loki run as Server and promtail run as log connect and push agent. promtail is always run as daemon-set on each log collection node. For appmesh node, bellow logs need to be collected together:
Default system log in /var/log
appmesh service log in /opt/appmesh/work/server.log
Managed application output log in /opt/appmesh/work/*.log So override promtail configuration (/etc/promtail/config.yml) to combine the 3 log target in one promtail configuration, each node only start one
promtaildocker container.