3. Build powerful monitor system with Grafana/Prometheus/Loki
App Mesh can manage all app applications running on Linux and provide build-in Prometheus exporter the metrics can be used to monitor hosted application detail running behavior. Loki can be used to collect all applications and App Mesh logs.
Grafana can be used as Prometheus and Loki web portal, with those components, we can build a runtime metrics and log aggregate system with a flexible GUI.

3.1. Deploy all component by docker compose
3.1.1. install docker-compose
sudo curl -L "https://github.com/docker/compose/releases/latest/download/docker-compose-$(uname -s)-$(uname -m)" -o /usr/local/bin/docker-compose
sudo chmod +x /usr/local/bin/docker-compose
3.1.2. Clone App Mesh source files
git clone --depth=1 https://github.com/laoshanxi/app-mesh.git
cd app-mesh
3.1.3. Deploy all in one YAML
This output comes from an older stack version. The current stack prints different service names.
cd app-mesh/script/docker
$ docker-compose -f docker-compose-all-in-one.yaml up -d
Creating script_prometheus_1    ... done
Creating script_loki_1          ... done
Creating script_consul_1        ... done
Creating script_grafana_1       ... done
Creating script_node_exporter_1 ... done
Creating script_alertmanager_1  ... done
Creating script_promtail_1      ... done
Creating script_appmesh_1       ... done
Creating script_appmesh-ui_1    ... done
Then you can access App Mesh UI (https://192.168.3.24/). Sign in with the user admin@appmesh.local. Setup generates the initial password and stores it in a credential file. Read the password from the appmesh_node container:
docker-compose -f docker-compose-all-in-one.yaml exec appmesh_node \
  sh -c 'grep "^password=" /opt/appmesh/work/auth/secrets/initial-admin-credentials'

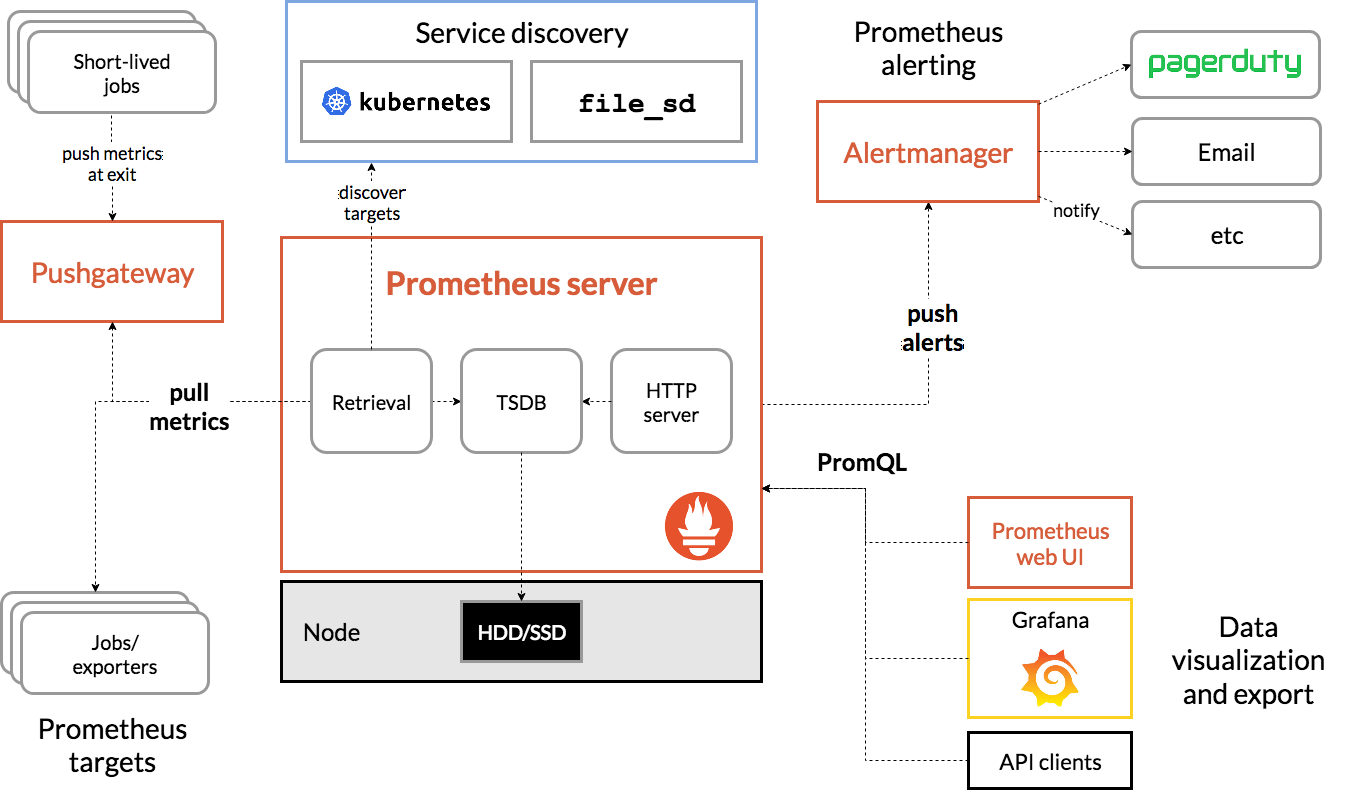
Monitor system: Grafana, Prometheus, Node Exporter, promtail, Alert Manager
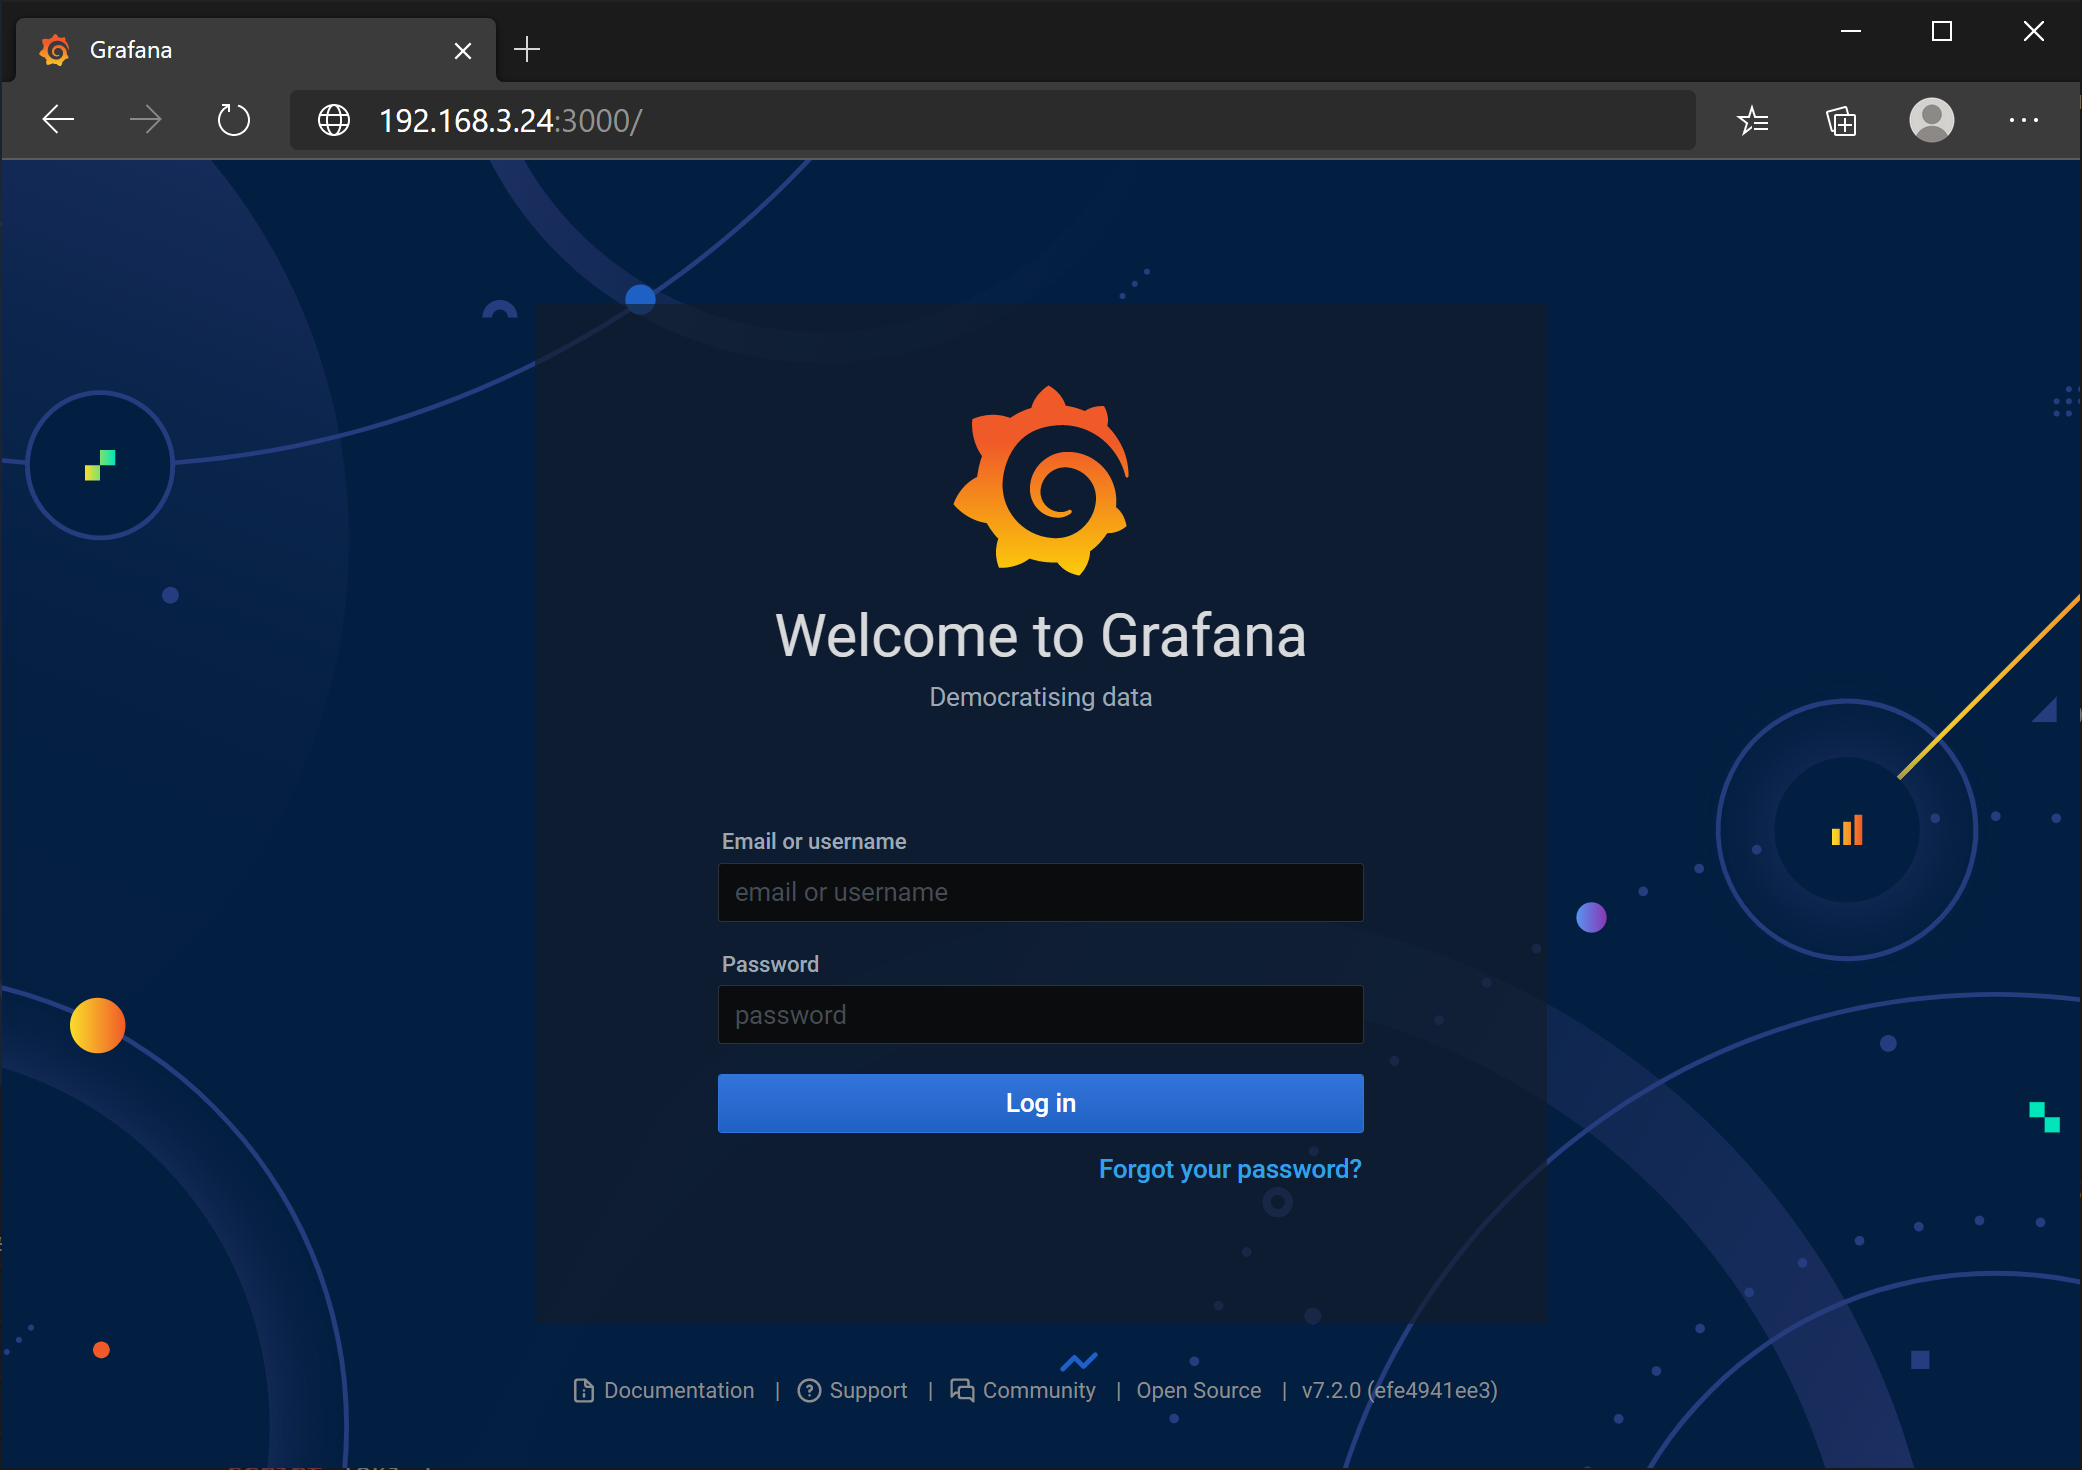
3.2. Login Grafana
Open target host http://192.168.3.24:3000/
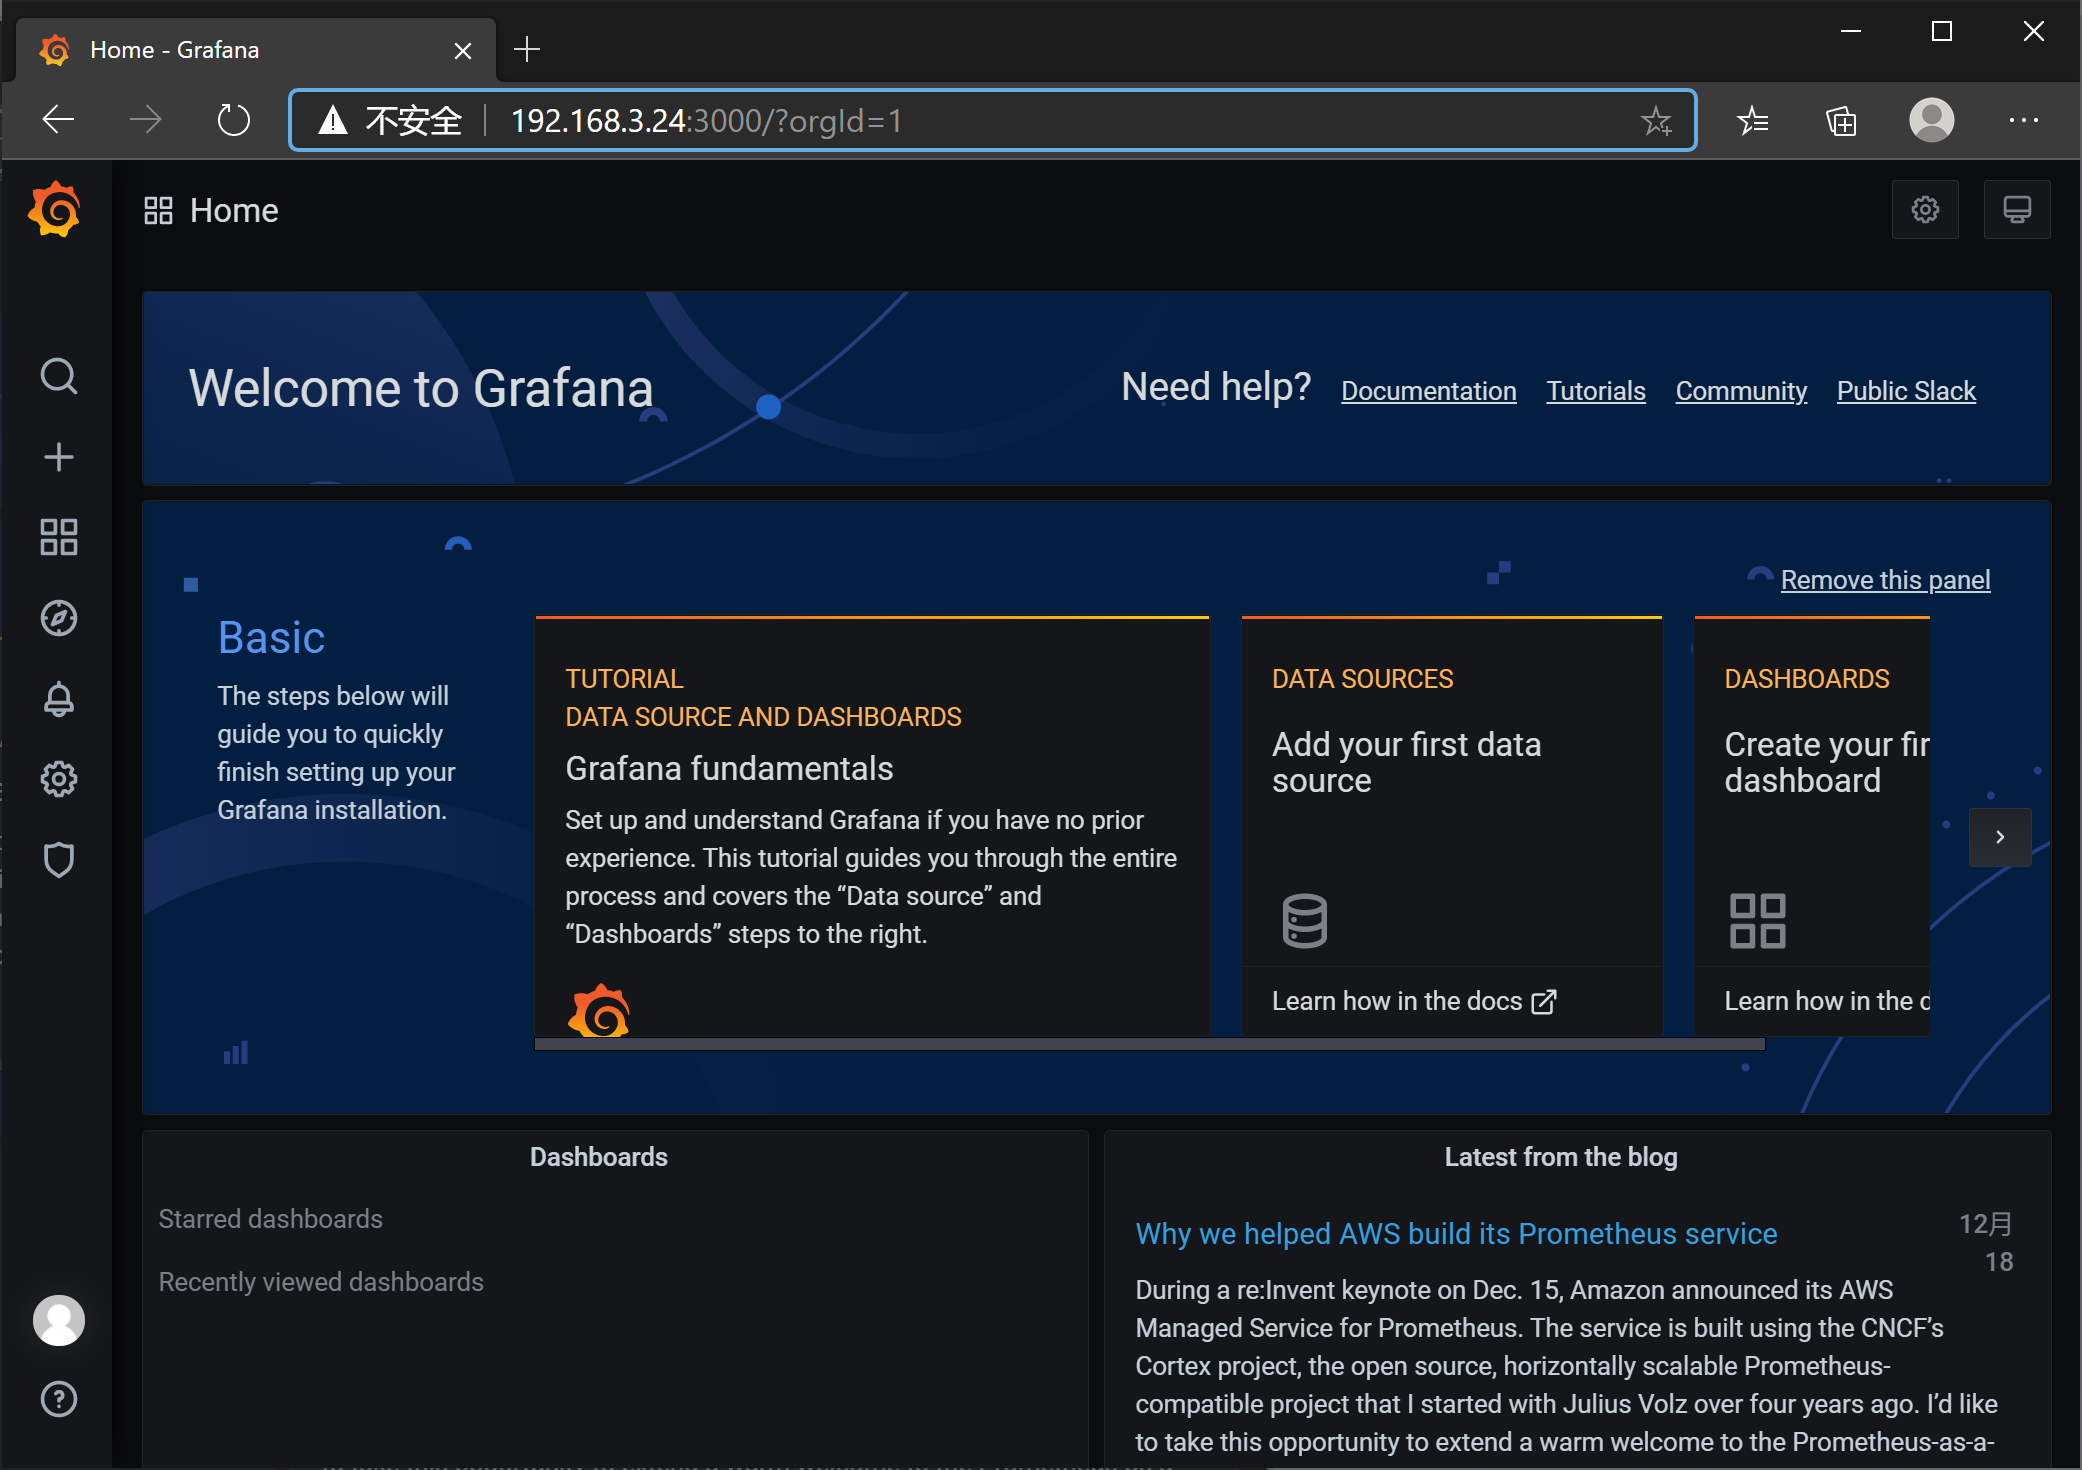
Input initial password admin/admin and change a new password for Grafana
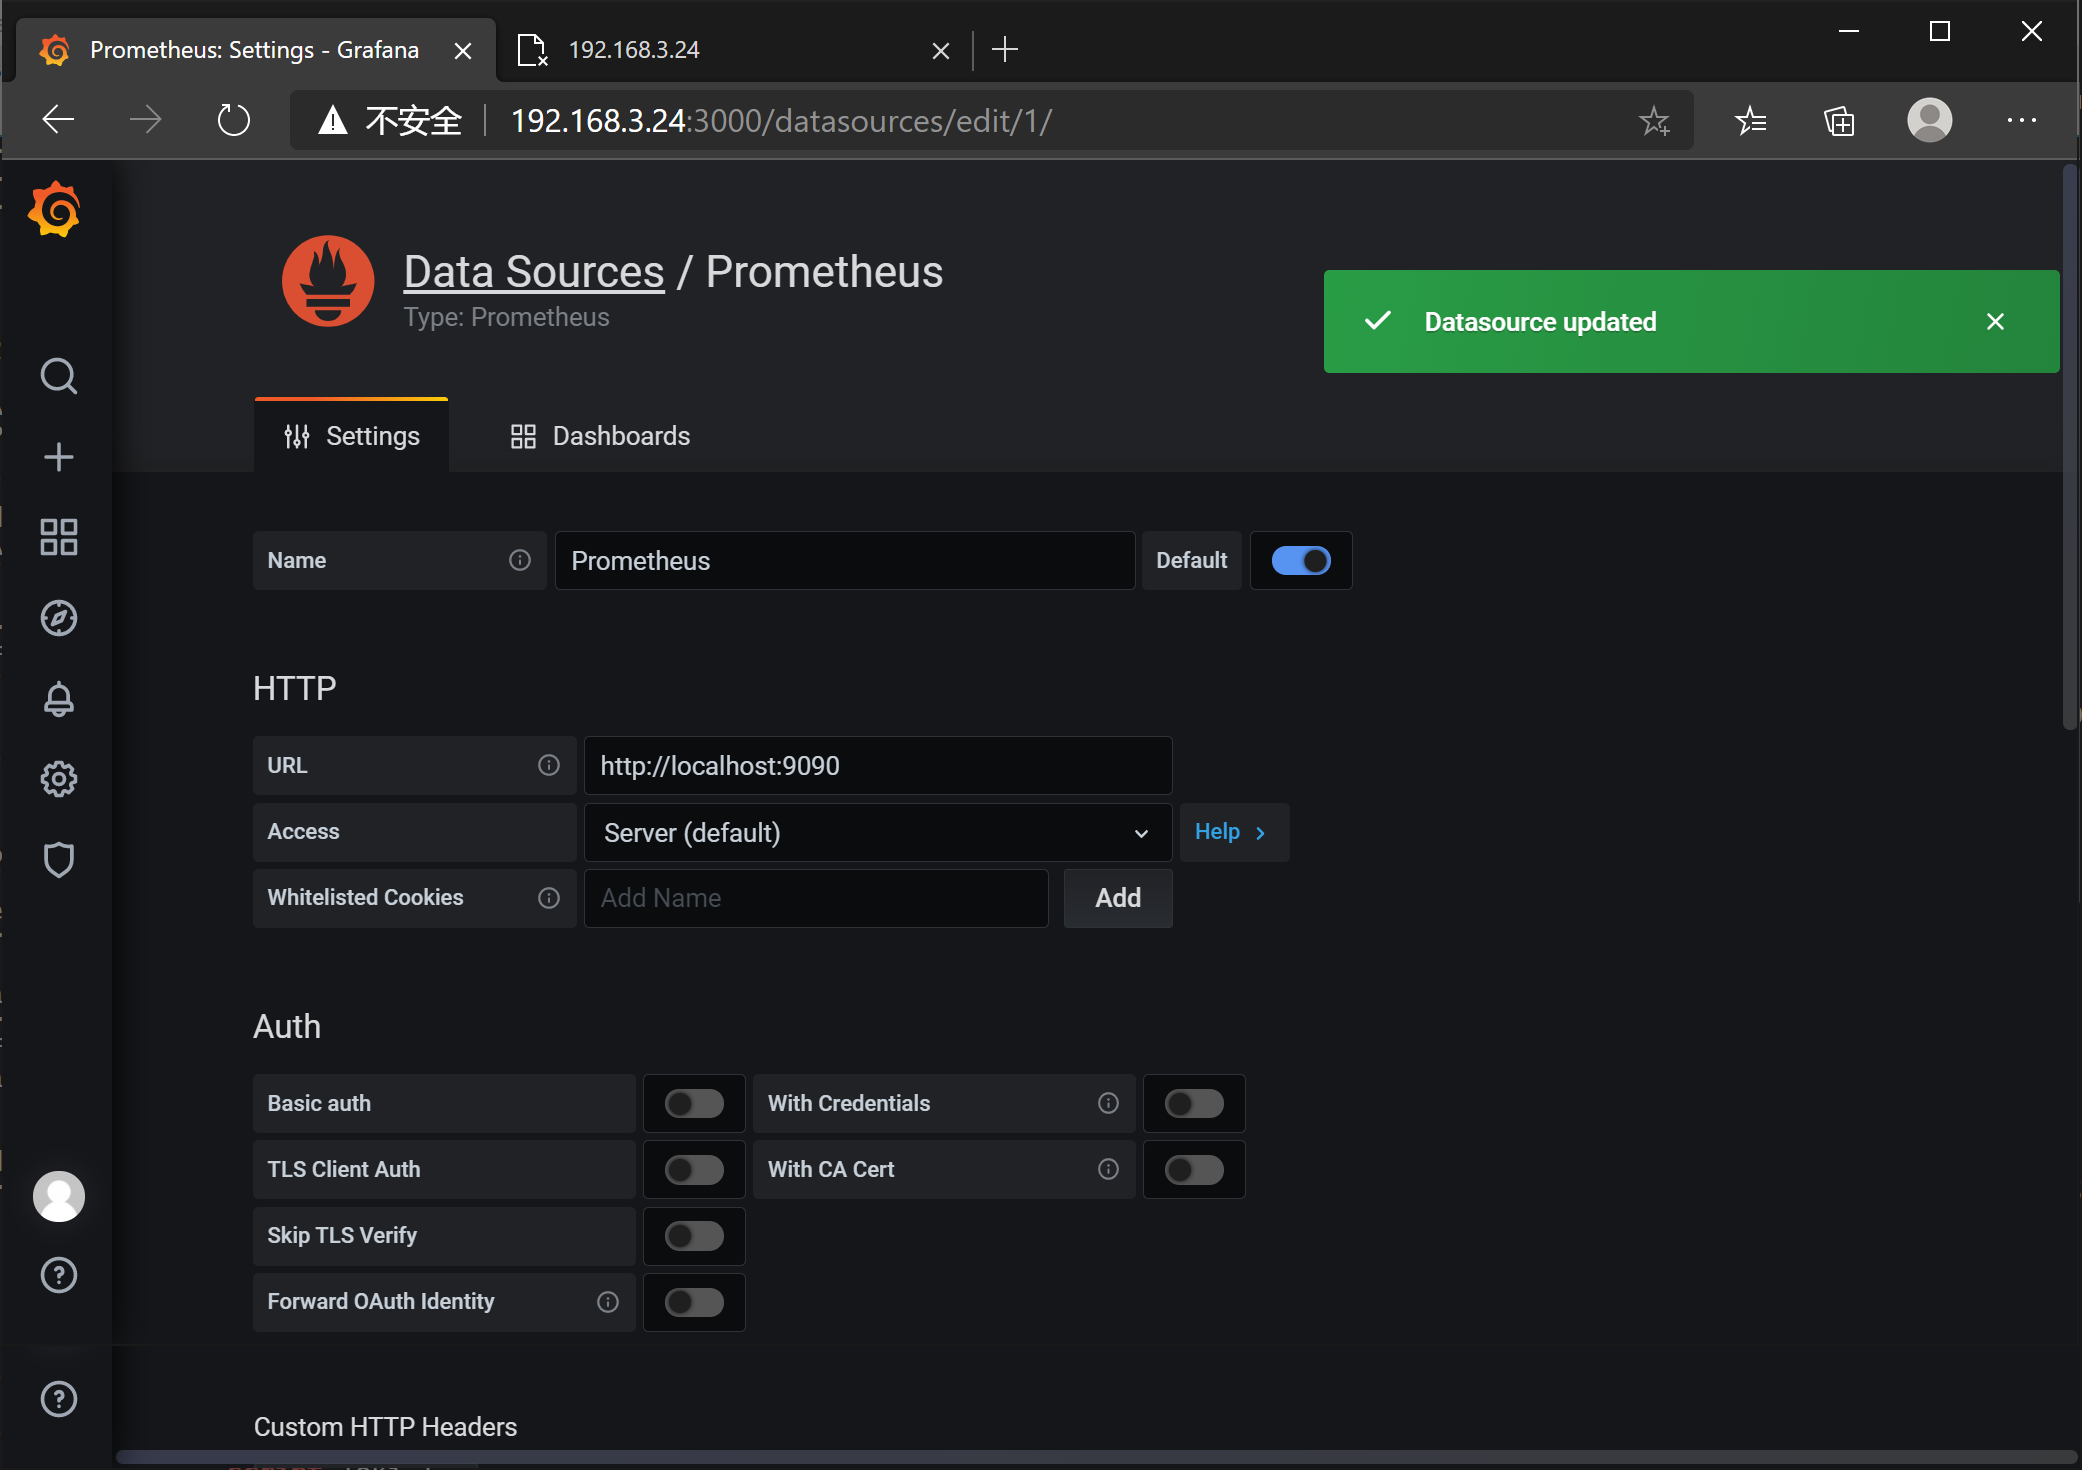
Add Prometheus Data Source with default address(http://localhost:9090/)
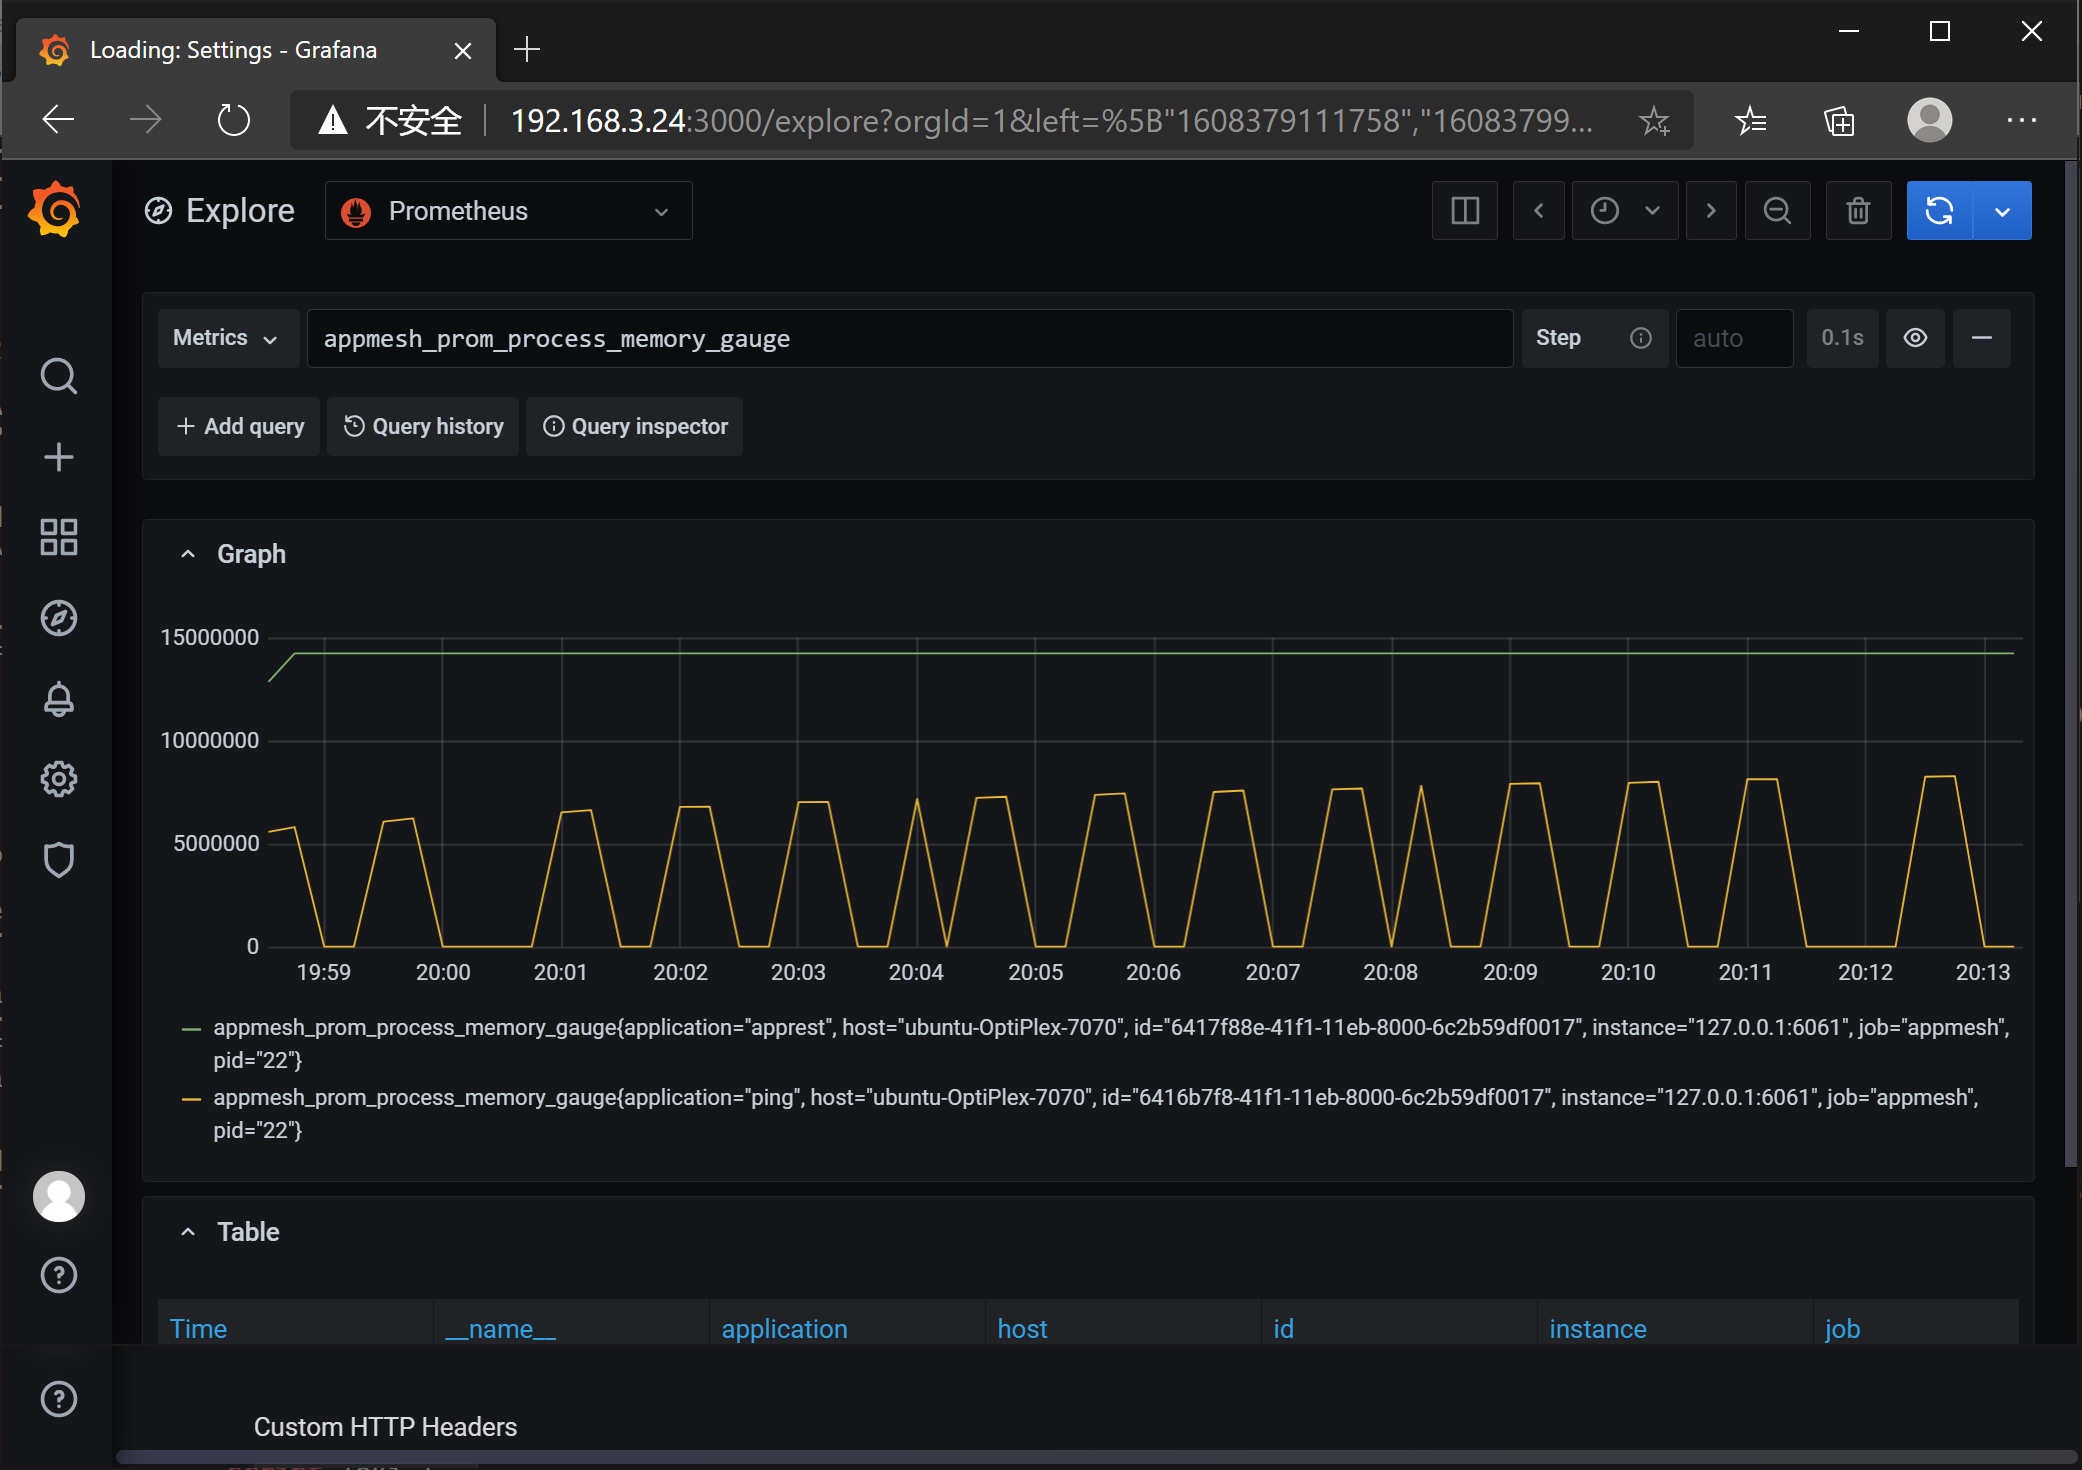
In Grafana Explorer page, you can query App Mesh metrics
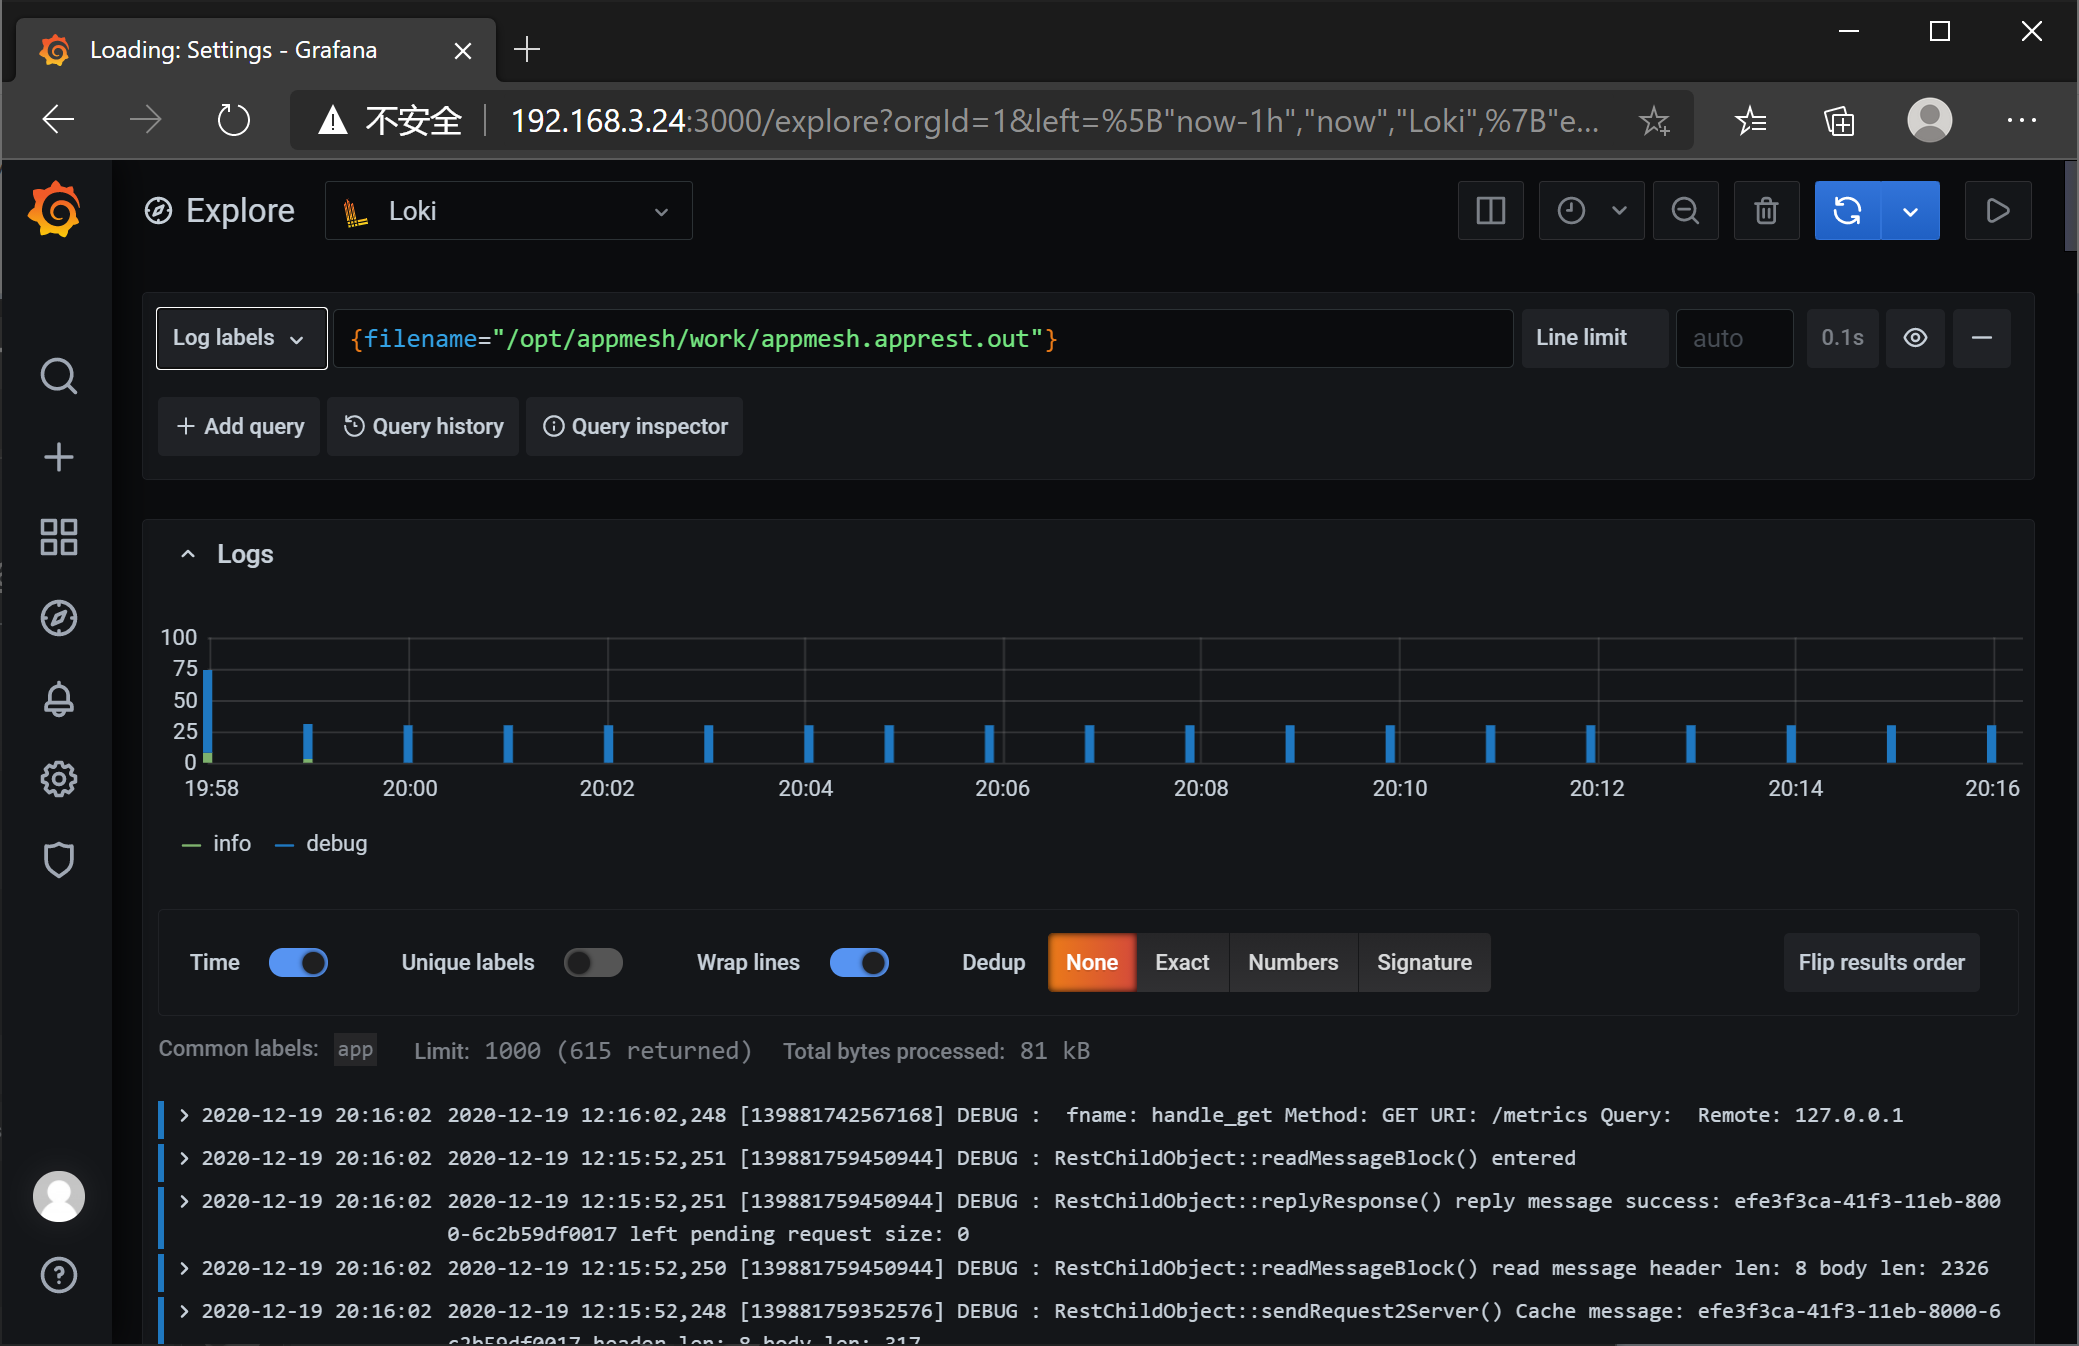
Add Loki Data Source with default address(http://loki:3100/)

In Grafana Exploere page, you can query all app stdout of App Mesh managed applications and App Mesh logs
3.3. Prometheus UI (alertmanager)
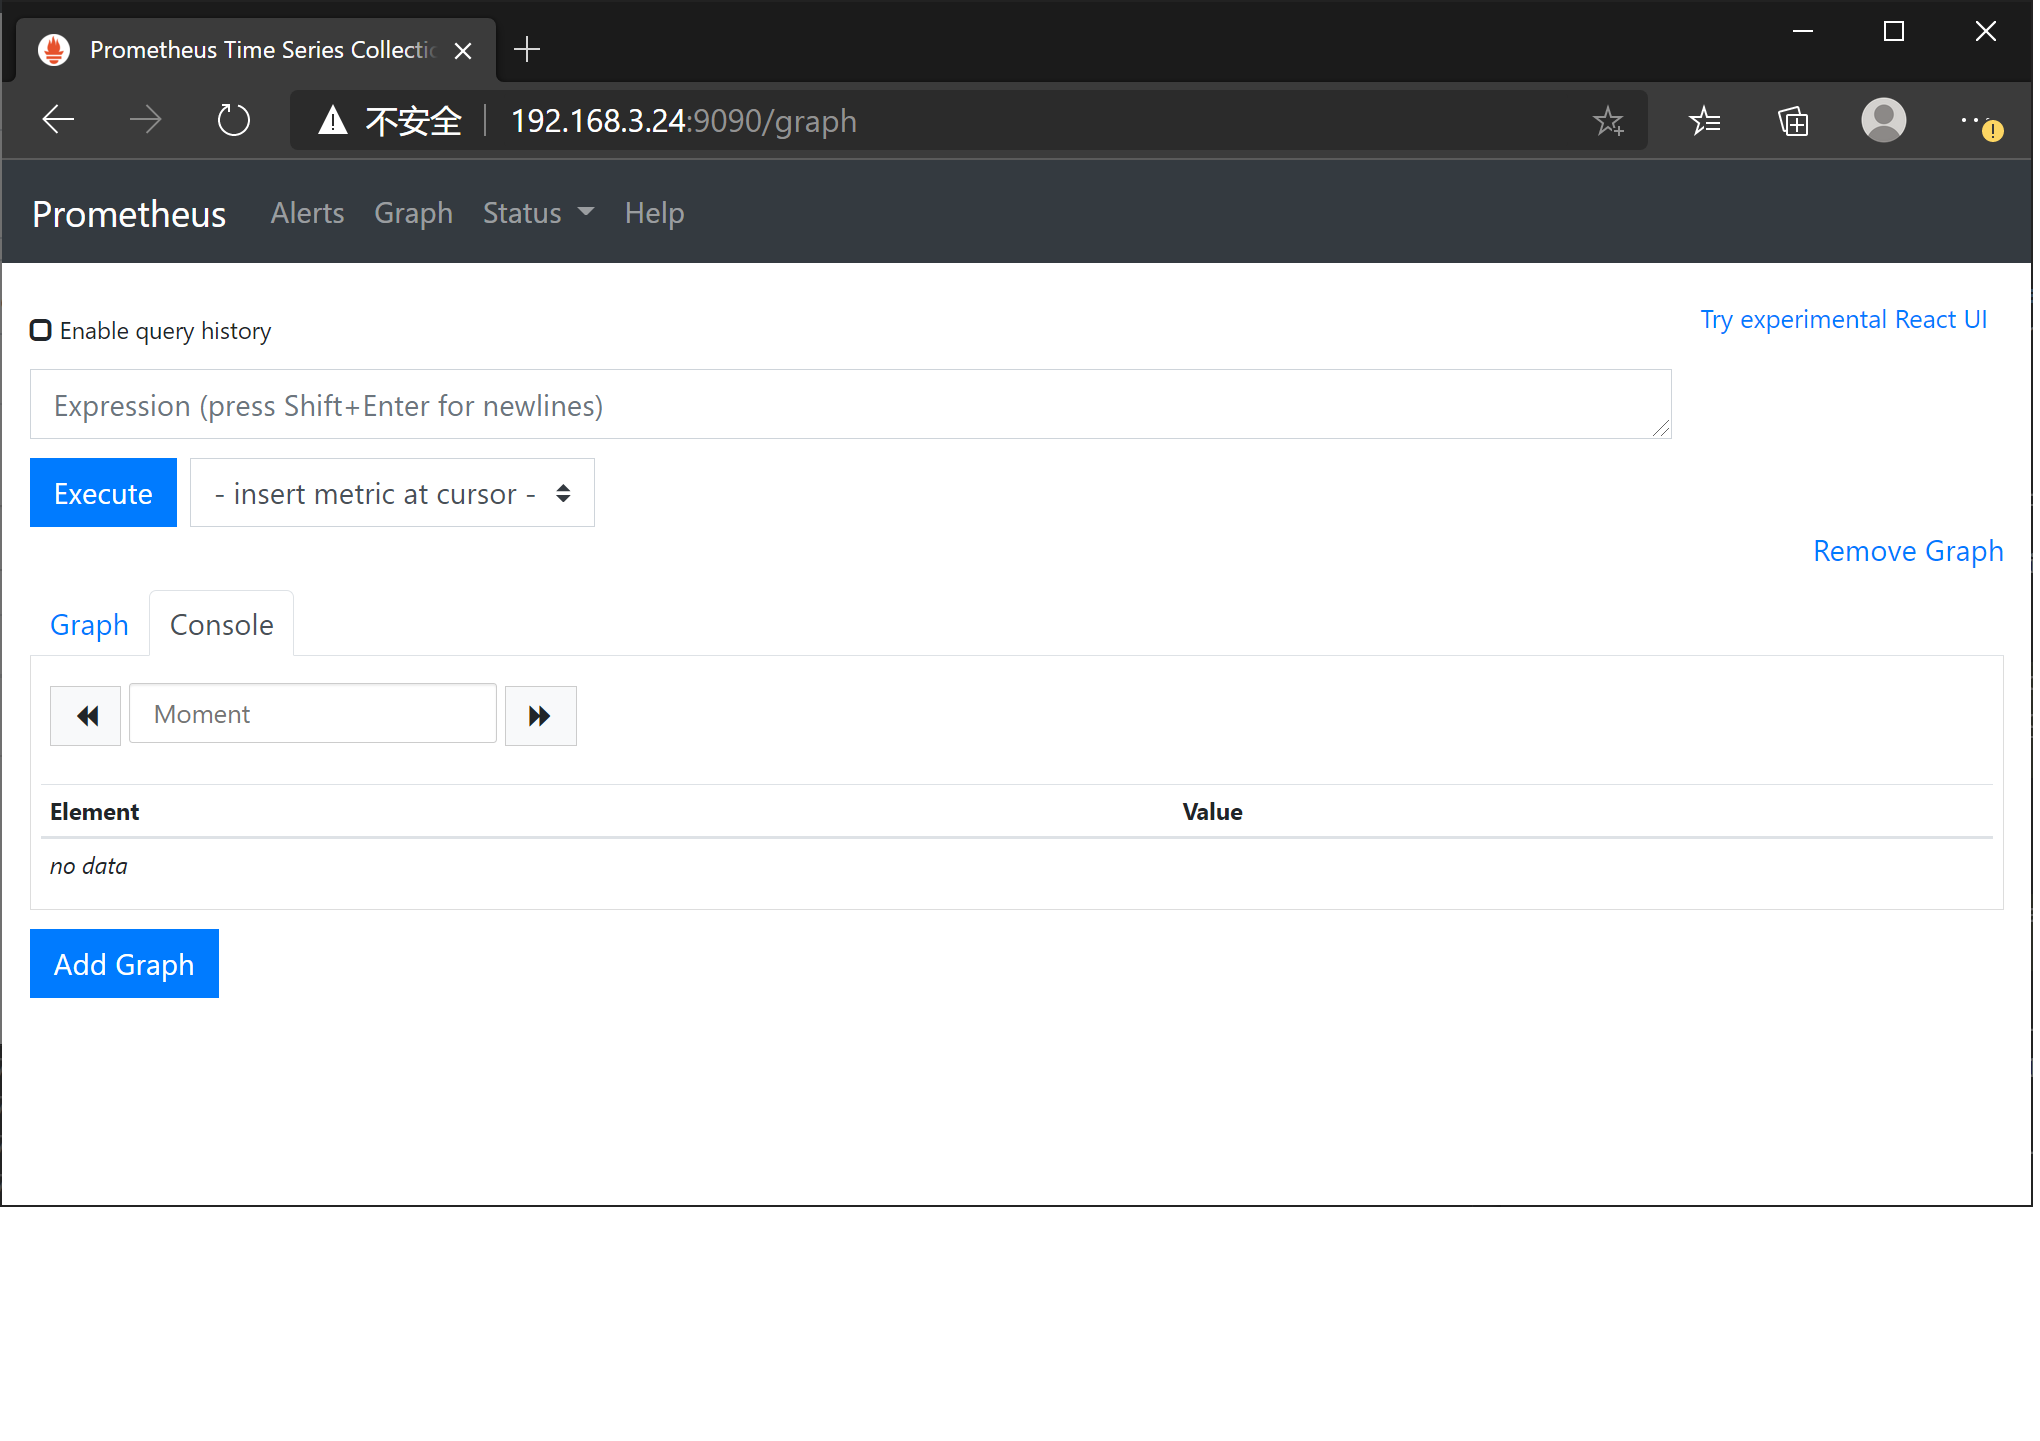
Open Prometheus WEB portal at http://192.168.3.24:9090/
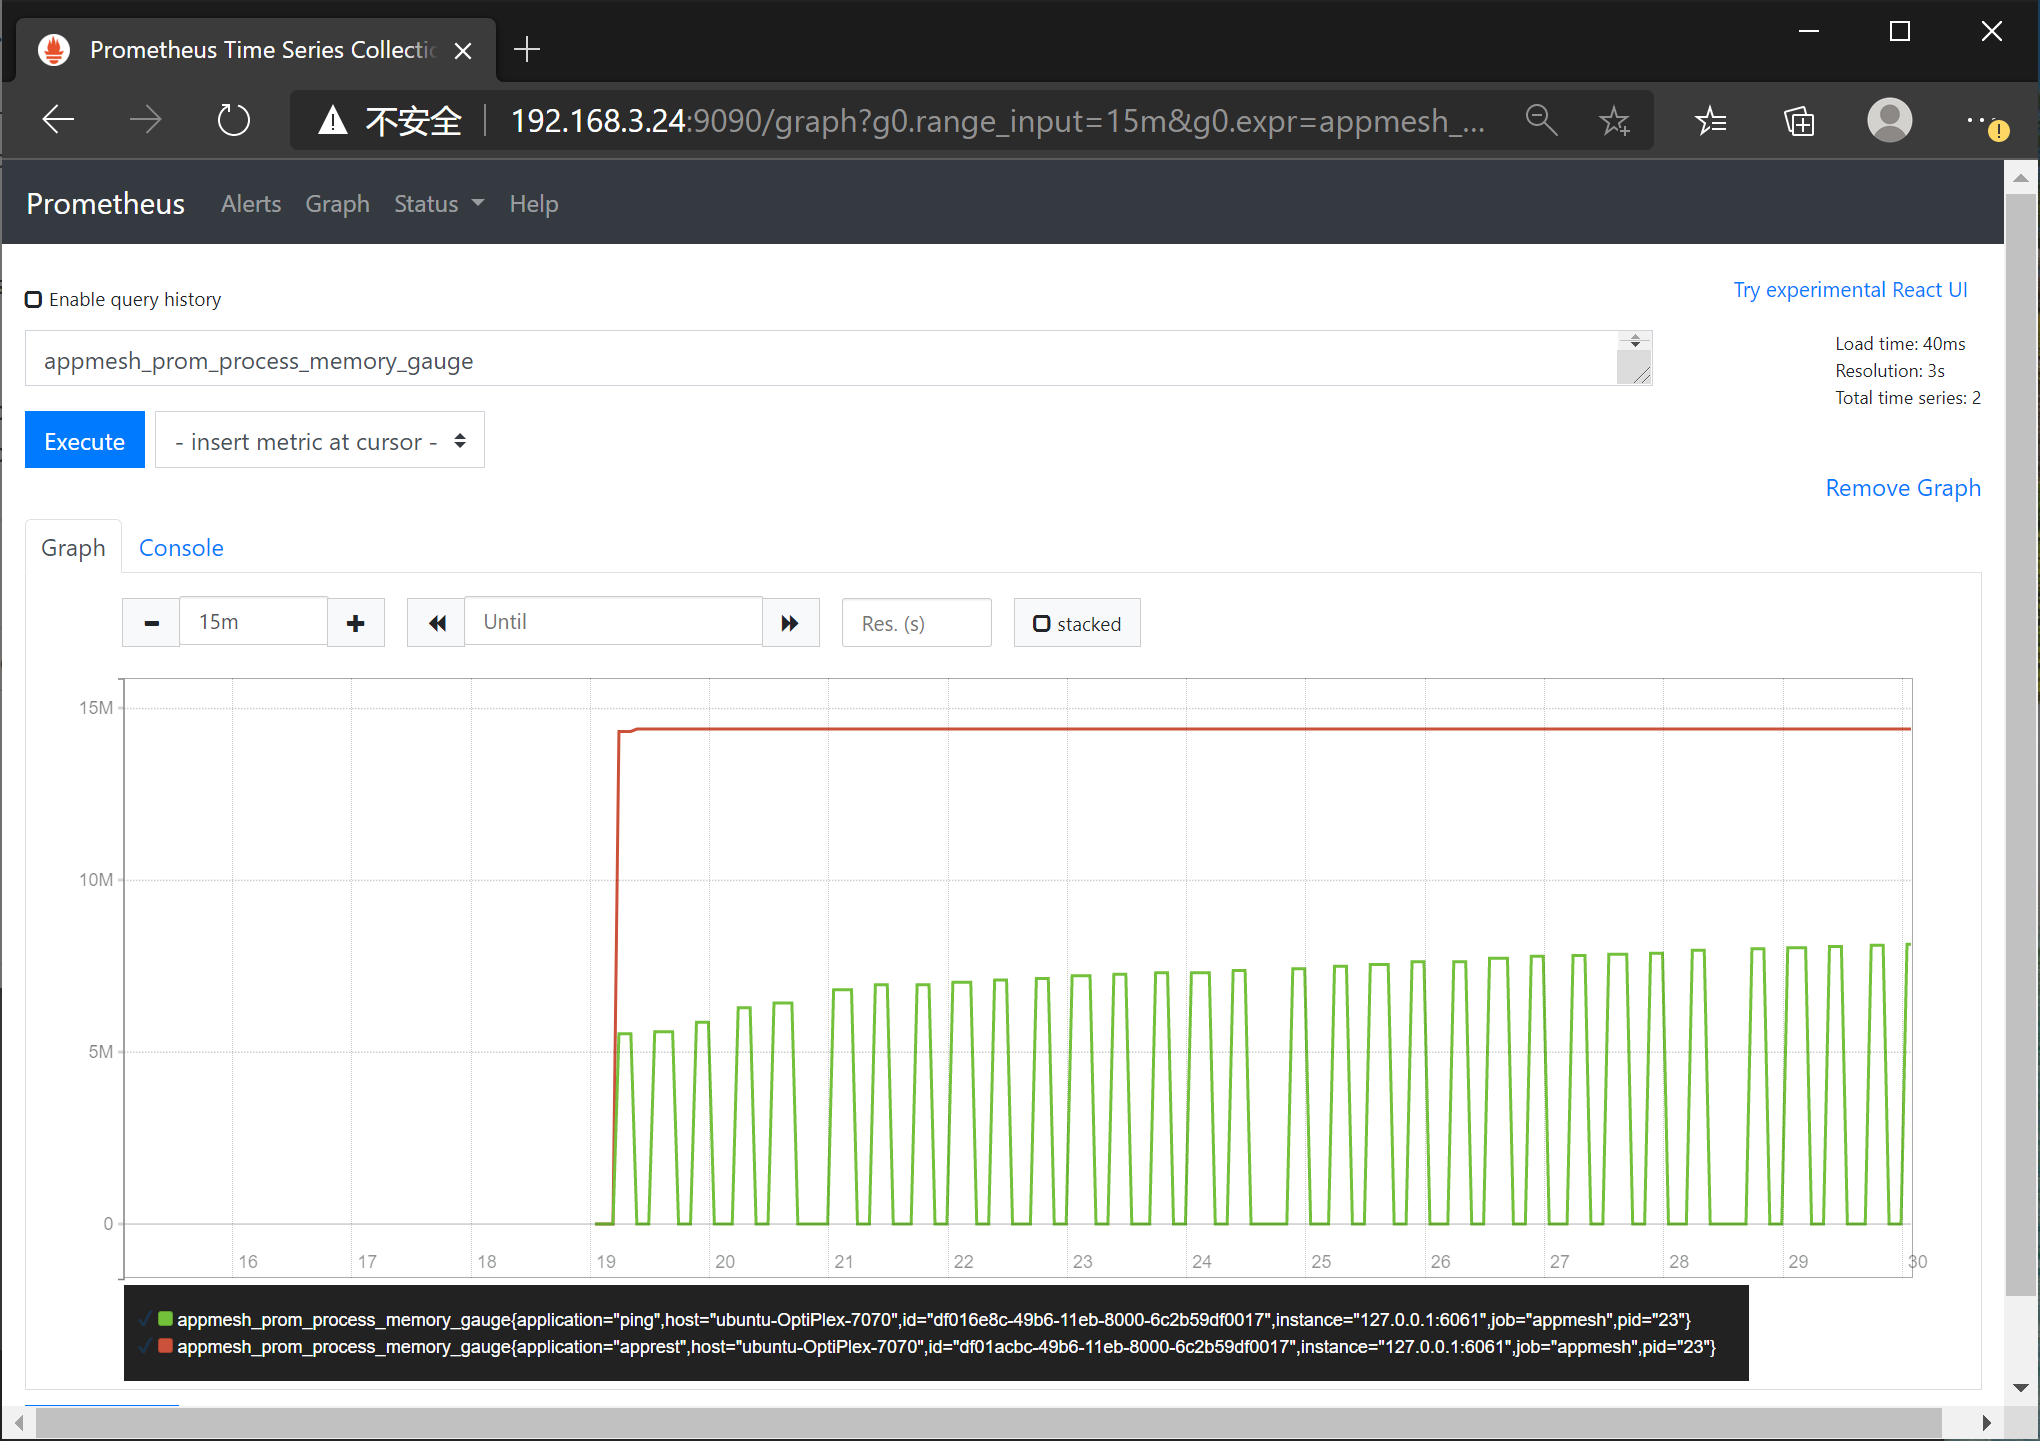
Query metrics: appmesh_application_process_resident_memory_bytes
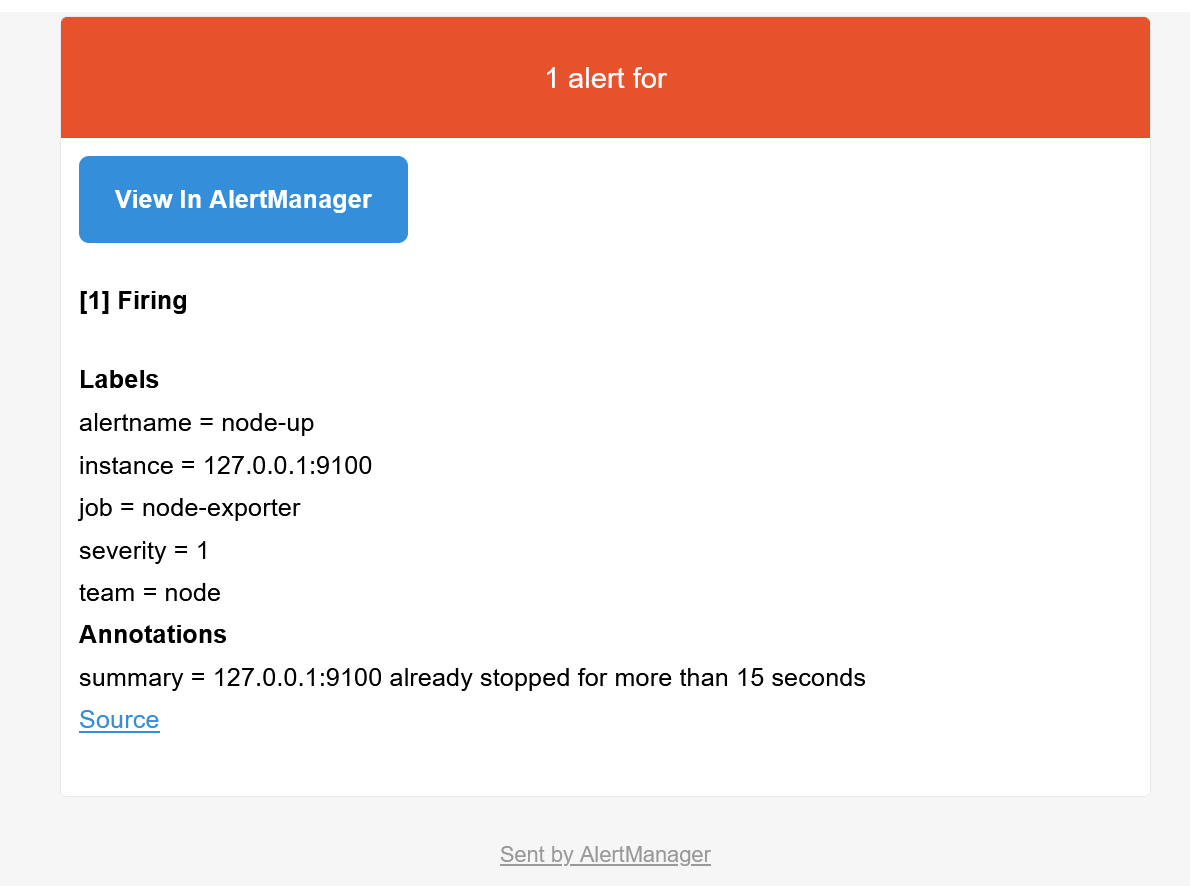
Stop node exporter to trigger alertmanager, you will get bellow email:
docker-compose -f docker-compose-all-in-one.yaml stop node_exporter
3.3.1. Clean docker compose started containers
cd app-mesh/script/docker
docker-compose -f docker-compose-all-in-one.yaml stop
docker-compose -f docker-compose-all-in-one.yaml rm -f