8. Prometheus Exporter
Prometheus, a Cloud Native Computing Foundation project, is a systems and service monitoring system. It collects metrics from configured targets at given intervals, evaluates rule expressions, displays the results, and can trigger alerts if some condition is observed to be true.

8.1. What is supported
App Mesh provide a build-in Prometheus exporter
Prometheus exporter is a build-in REST server for Prometheus to scrap metrics
8.2. What is not supported
Exporter SSL is not supported as community
8.3. Start Grafana, Prommetheus
git clone --depth=1 https://github.com/laoshanxi/app-mesh.git
cd app-mesh/script/docker
docker-compose -f docker-compose-all-in-one.yaml up -d
8.3.1. Configure Grafana
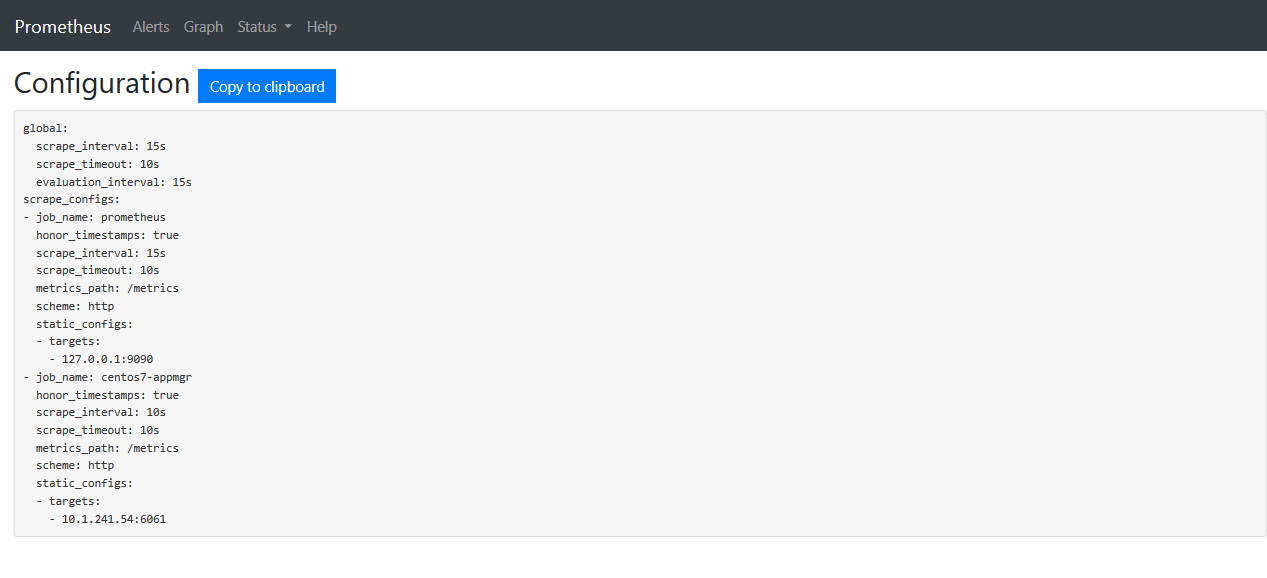
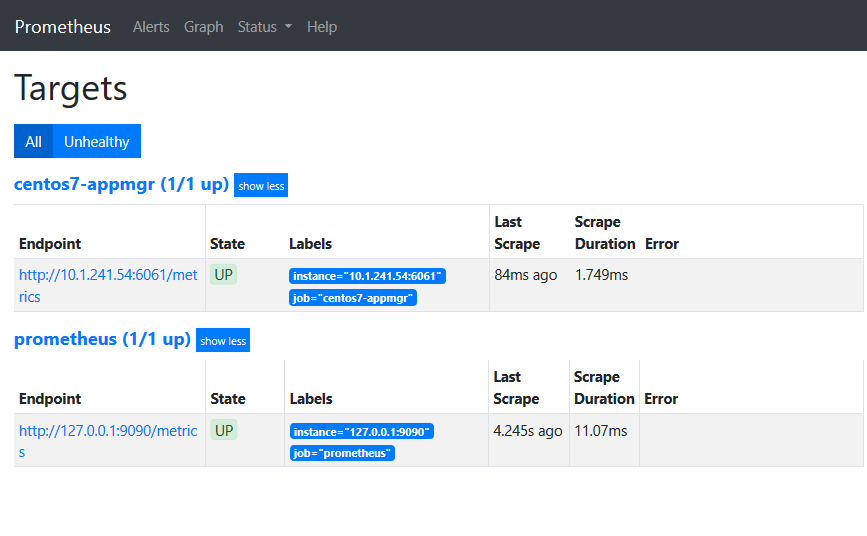
Access Prometheus 9090 UI (http://prom_node:9090/) to verify
Open Grafana on 3000 port (http://grafana_node:3000/)
Add DataSource: Prometheus
Input Prometheus address: http://script_prometheus_1:9090 (this address is Grafana access Prometheus docker container name)
Select Explore -> Metrics
8.3.2. Design
Prometheus is monitoring system and time series database, every metric (unique by label) will be a time series data in DB, and use pull way to scrap data from Server to Client, client provide a exporter service listen on a local port, the exporter is build with Application together to read metric data from memory. appmesh provide a exporter service listen at the port configured by REST.PrometheusExporterListenPort (default 0 means disabled, e.g. set to 6061). The exporter run build-in with appmesh and no need extra process.
In order to collect node metrics, an extra node-exporter can be started on each node and listen on 9100 to provide node metrics service.
8.3.3. Defined Metrics
# HELP appmesh_prom_scrape_count prometheus scrape count
# TYPE appmesh_prom_scrape_count counter
appmesh_prom_scrape_count{host="appmesh",pid="10791"} 6.000000
# HELP appmesh_prom_file_descriptor appmesh file descriptors
# TYPE appmesh_prom_file_descriptor gauge
appmesh_prom_file_descriptor{host="appmesh",pid="10791"} 11.00000000000000000
# HELP appmesh_prom_process_start_count application process spawn count
# TYPE appmesh_prom_process_start_count counter
appmesh_prom_process_start_count{application="appweb",host="appmesh",pid="10791"} 1.000000
appmesh_prom_process_start_count{application="timer",host="appmesh",pid="10791"} 0.000000
# HELP appmesh_http_request_count app mesh http request count
# TYPE appmesh_http_request_count counter
appmesh_http_request_count{host="appmesh",method="POST",pid="10791"} 0.000000
appmesh_http_request_count{host="appmesh",method="DELETE",pid="10791"} 0.000000
appmesh_http_request_count{host="appmesh",method="PUT",pid="10791"} 0.000000
appmesh_http_request_count{host="appmesh",method="GET",pid="10791"} 0.000000
# HELP appmesh_prom_scrape_up prometheus scrape alive
# TYPE appmesh_prom_scrape_up gauge
appmesh_prom_scrape_up{host="appmesh",pid="10791"} 1.000000
# HELP appmesh_prom_process_memory_gauge application process memory bytes
# TYPE appmesh_prom_process_memory_gauge gauge
appmesh_prom_process_memory_gauge{application="appweb",host="appmesh",pid="10791"} 3268759.000000
appmesh_prom_process_memory_gauge{application="timer",host="appmesh",pid="10791"} 0.000000
# HELP appmesh_prom_process_file_descriptors application process file descriptors
# TYPE appmesh_prom_process_file_descriptors gauge
appmesh_prom_process_file_descriptors{application="apprest",host="appmesh",id="4229730c-5672-11eb-8000-6c2b59df0017",pid="83288"} 13.00000000000000000